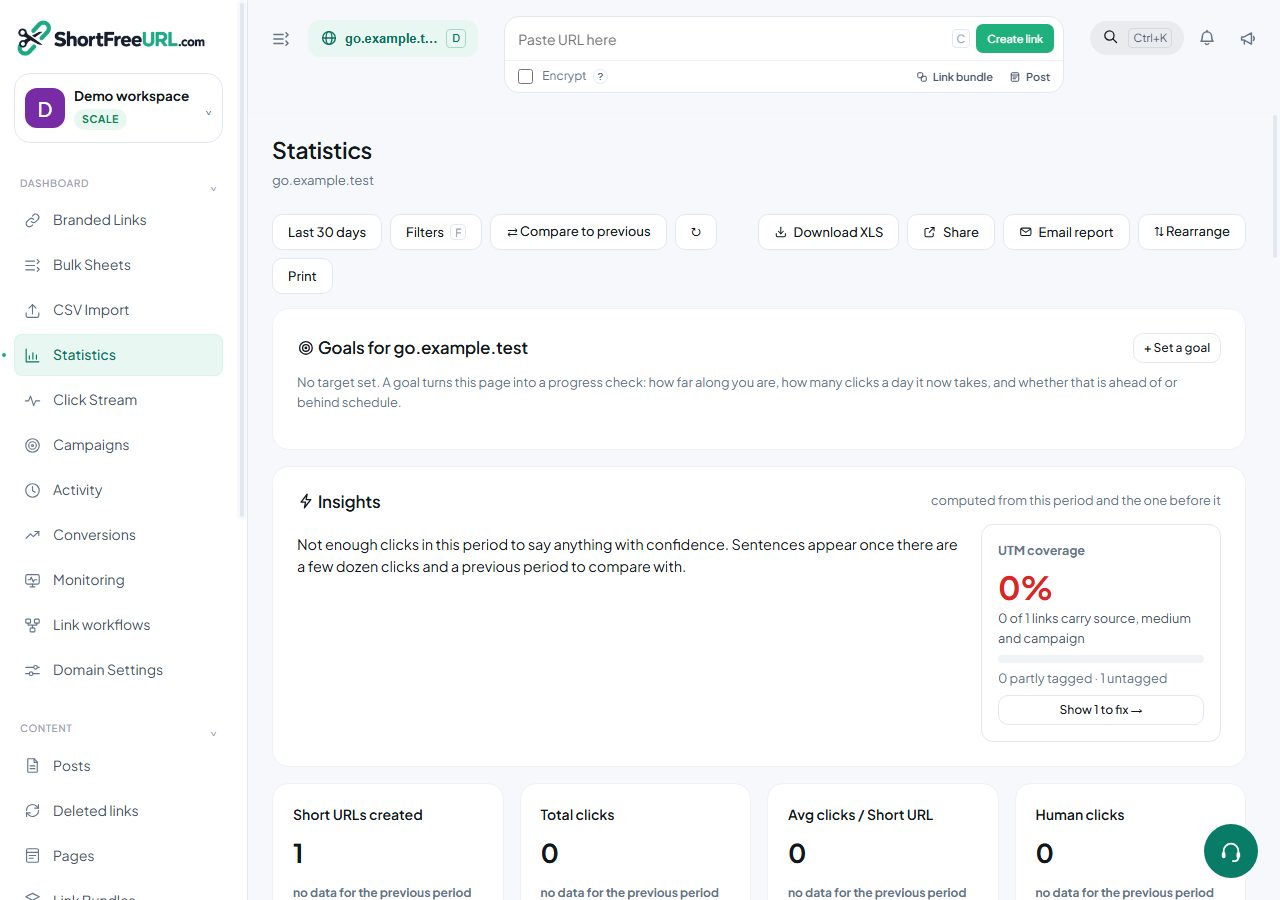
Every statistics view — the overview, a domain, a link, the click stream and conversions — shares one filter state. Set it once and it follows you between pages.
Date ranges
The period control offers the usual presets and a custom range. The comparison shown on the KPI cards is always the immediately preceding window of the same length, so a 7-day view compares against the 7 days before it. Changing the interval on the click chart between hour, day, week and month does not change the range, only the bucket size.
The date grouping uses the domain's reporting timezone, set under Domain settings, Statistics. If your audience is in one country and your team is in another, set it to the audience's timezone: a daily chart bucketed in UTC puts a domestic evening peak on the wrong day.
The click mode
Three values, and it is the filter people forget:
- All — every request.
- Humans — bot flag clear.
- Robots — bot traffic only, which is worth looking at occasionally to see what is fetching your links.
Dimension filters
Country, region, city, browser, OS, device, status, path, social network, referrer host, UTM source, medium and campaign, plus folder, tag and QR-only. Multiple values within one dimension are OR; different dimensions are AND. So two countries and one browser means "either country, on that browser".
Filter values are populated from your own data, so the country list contains only countries that have actually clicked. There is also a free-text search that matches path and destination.
Dimension filters are on the Growth plan and above. Date range and the human/bot mode work on every plan, and the dashboard says so rather than hiding the controls.
Filters and exports
The XLS export from the statistics page and the CSV export from the click stream both respect the active filters. That is the intended way to answer a specific question: filter until the view is the question, then export the answer.
A caution about narrow filters
Filtering to a city and a browser and a campaign will usually leave you with a sample too small to mean anything. Filter to one dimension at a time, read the number, then decide whether the next filter is worth adding.
Find this in your dashboard
- Sign in and select the workspace and domain you want to manage.
- Open Statistics. Review the article’s steps and your plan’s available controls.
- Save your changes, reopen the record and verify the saved result. For routing changes, check the short link with a test visit.