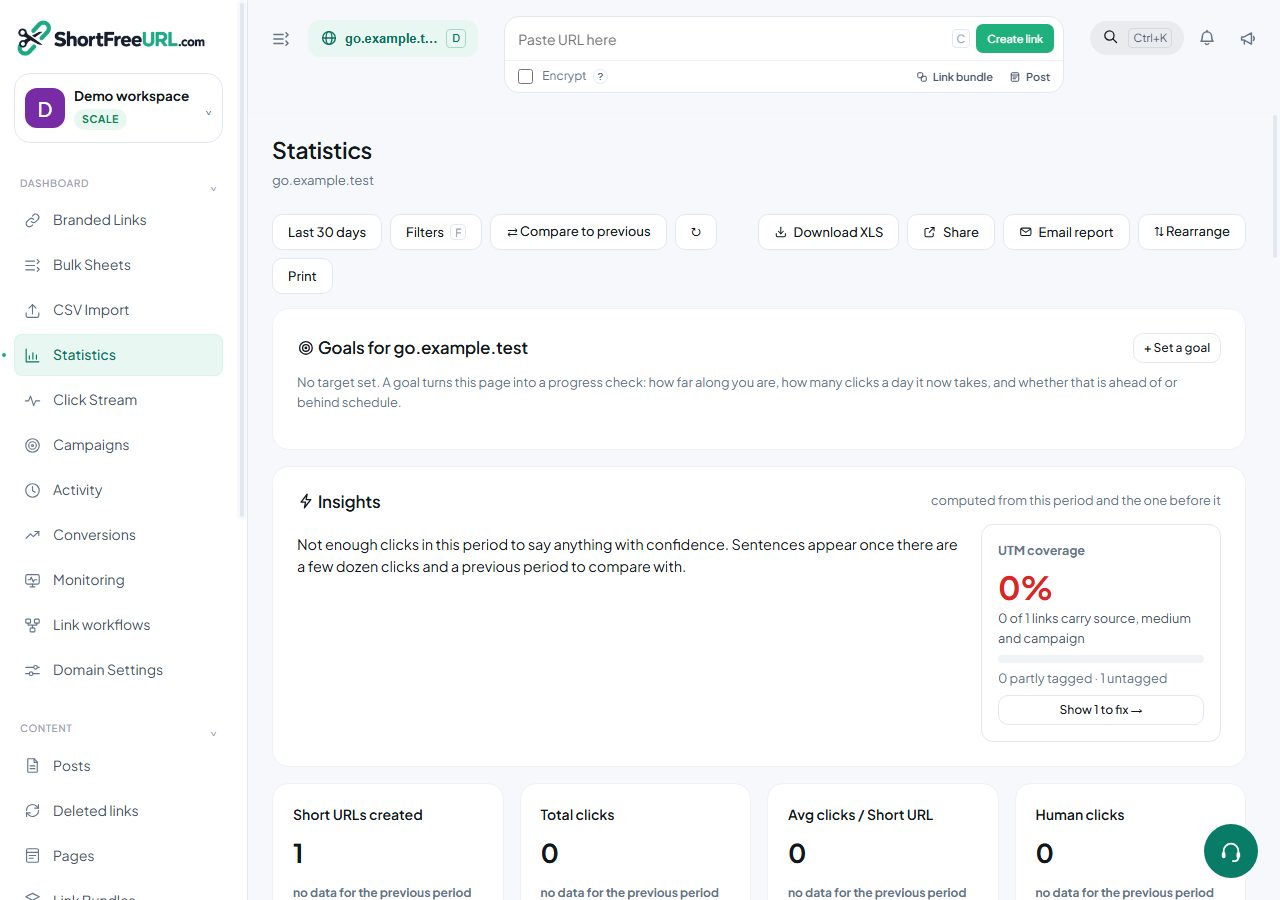
Statistics exist at three levels: the organisation-wide overview on the home screen, a page per domain, and a page per link. All three obey the same date range and filters.
The four KPI cards
- Short URLs created — links created inside the window, not links that exist.
- Total clicks — every request that reached the redirector, bots included.
- Avg clicks / short URL — total clicks divided by links created.
- Human clicks — clicks with the bot flag clear.
Each card compares against the immediately preceding window of the same length. When the previous window is empty there is no comparison shown, because growing from zero is not a percentage and printing one would read like a trend.
The cards below
Clicks over time, with hour, day, week and month intervals, and gaps filled so a quiet day reads as zero rather than disappearing. Then a set of breakdowns: top links, countries with a world map, states and regions, cities, referrers, social referrers, browsers, operating systems, devices, UTM sources, mediums and campaigns, and languages. A heatmap shows clicks by hour and weekday. Conversion and QR scan cards appear alongside them, and an A/B variations card when a link has variations.
Every breakdown row is clickable: it opens the detail view for that dimension, which is the full list rather than the top handful. The top lists show a small logo or flag in front of each browser, operating system, referrer, social network, country and city, and the countries map spans the full width of the page.
Trends (Starter and above, new in September 2026)
- Previous-period line — a dashed line on the clicks chart for the window just before, bucket for bucket.
- Top links leaderboard — the ten busiest links with their change against the previous period and a small trend line each.
- Traffic sources — clicks split into social, search, email, direct and other websites.
- Unique vs total clicks — unique visitors, clicks per visitor and the share of returning visitors. Clicks on domains that hide visitor IPs are counted separately.
- Best time to post — the busiest hour, day and three-hour stretch in your timezone, once there are at least 20 clicks.
- Print — lays the page out for paper or Save as PDF.
On Free these cards show a lock and an Upgrade button.
Rearranging
The Rearrange control reorders the cards and the order is remembered. Nobody needs the language breakdown above the click chart, and different teams disagree about what comes second.
QR scans
Scans arrive with ?qr=1 on the URL, so they are recorded as scans and reported separately from ordinary clicks. A QR code you generated here always carries the parameter; a code someone else generated from your short URL does not, and its scans count as ordinary clicks.
Exporting and sharing
Download the current view as XLS, respecting the active filters. The Share control publishes a read-only statistics page on a URL you can hand to someone without an account, and shared pages can be revoked from the same place.
Nothing is sampled
Every request is written to the click log. The numbers are counts, not estimates.
Find this in your dashboard
- Sign in and select the workspace and domain you want to manage.
- Open Statistics. Review the article’s steps and your plan’s available controls.
- Save your changes, reopen the record and verify the saved result. For routing changes, check the short link with a test visit.